• Versatile
  • Efficient
  • Lightweight
  • Modern
  • Adaptable
  • Versatile
Network Monitoring

Run a fleet of programmable probes that continuously check the health of your network.

We're in early access and inviting enthusiastic network engineers to try the tool, kick the tires, and help shape what gets built next. The roadmap below is real, and your voice carries weight in how it unfolds.
screenshot

Cloudy fits wherever network reliability matters. Here are the situations where it shines the most.

1. Cloud Migration

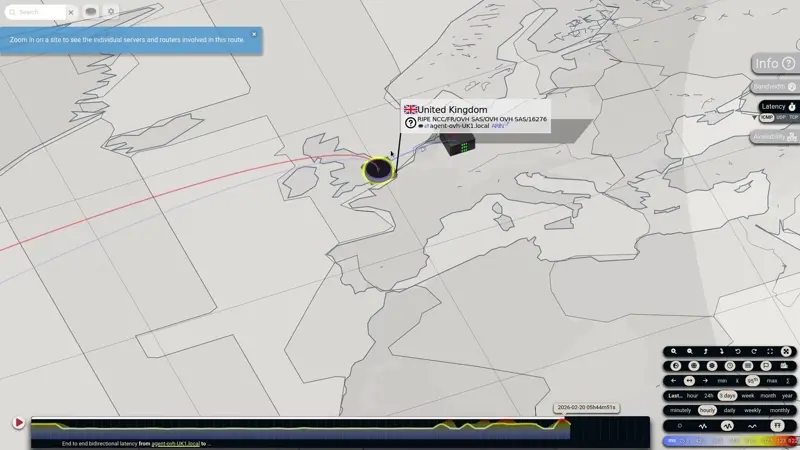
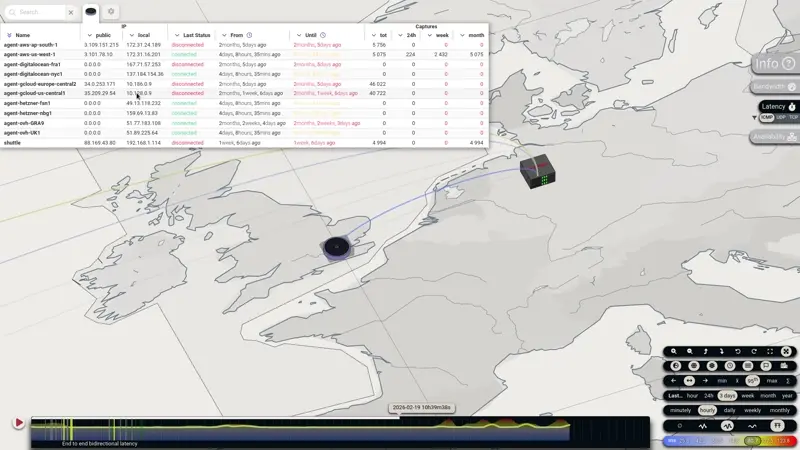
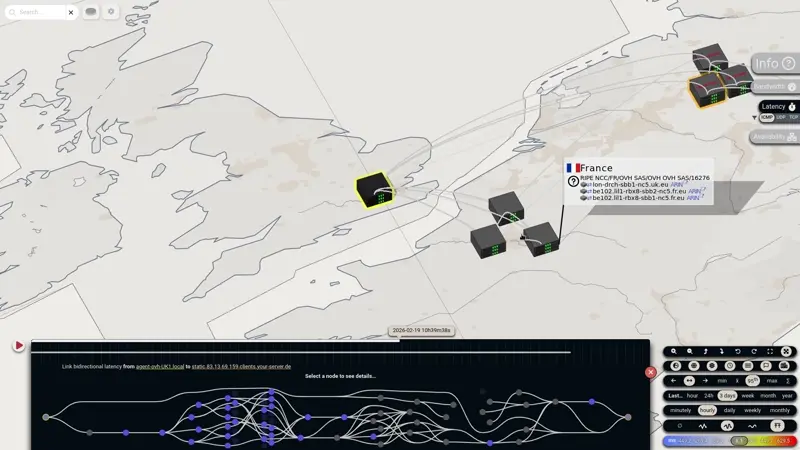
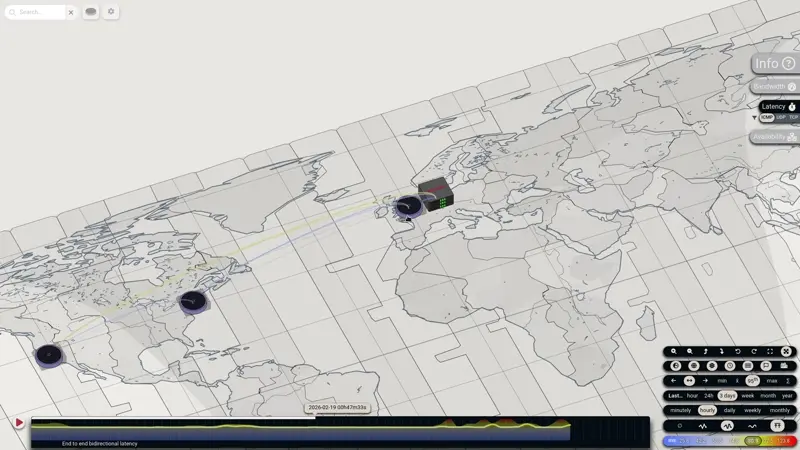
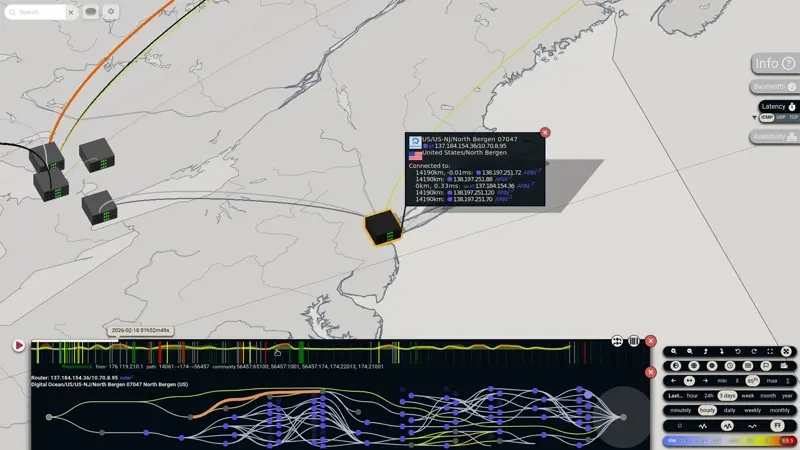
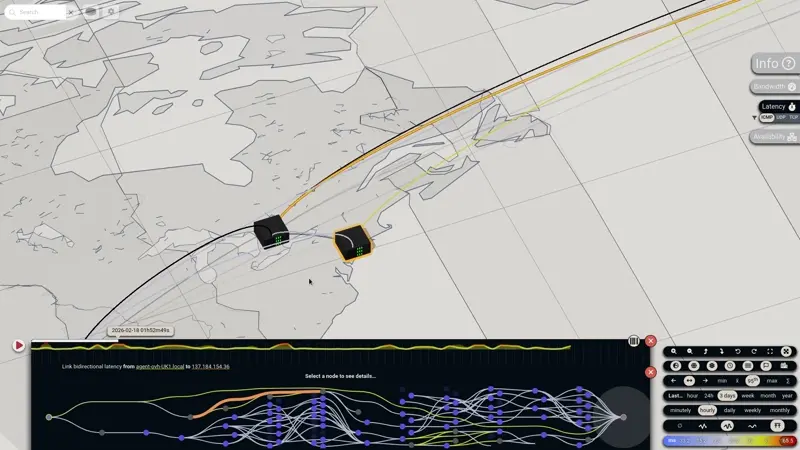
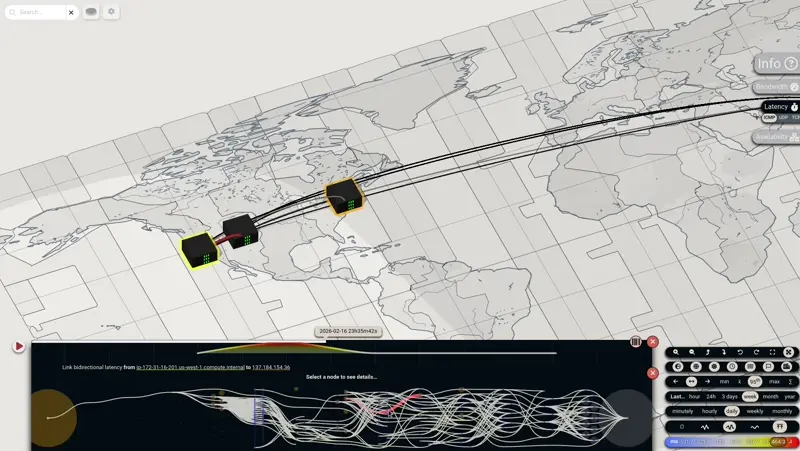
Moving services in the cloud?

Measure the real latency cost, track reliability over time, and verify whether performance matches your architecture's assumptions.

2. Agentic SRE

Operating a fleet of AI agents to scan your apps" logs and telemetry?

Let your agents run and tailor synthetic network measurements to get exactly what they need.

3. Infrastructure & IaaS

Not sure your provider is delivering what they promised?

Monitor the routes between your offices and your proxies, and hold your SLAs to account with hard data.

4. Online Services

Your status page says green; But is your front-end actually reaching your customers?

Measure real network performance end-to-end, independently of your cloud provider.

A couple of probes. Continuous measurement. Your actual SLO, verified.

Lightweight probes easy to deploy.
Once started, probes automatically connect to the server and get on with the program.

No configuration needed beyond the connection key.

Hierarchical map.
The map adapts to the level of complexity you want to see. More details are added into the map as you zoom in; Or aggregated into clusters as you zoom out.
Bidirectional traceroute.
Measure latency along monitored routes, compare against historical and theoretical baselines, and watch routes shift over time.
Support for BGP.
BGP events appear on the timeline for easy correlation. Suspicious behaviour like route flapping is flagged automatically.
Drill down to each individual measurement.
Click any link in the traceroute panel to explore the full table of individual measurements.
Download raw packet captures.
Want to inspect a specific measurement? Download the PCAP it was captured from directly from the UI.

If you have a testing account

Use the contact form below to obtain a testing account.

If you have a production account

1. Sign Up

Create your account with just an email.

You'll receive a secret key.

2. Deploy Some Probes

Pull the docker image ghcr.io/cloudywithachanceoflatency/cwacol-agent:master (approx. 3MiB), and run it with the secret key as the only argument.

(for bidirectional measurements, probes must be able to connect to each others.)

3. You're in!

First results appear within minutes.

From the UI, you can configure what the probes measure, launch more probes, and manage the fleet.

  • Done
  • Doing
  • Planned